Table of contents
Video 16 Classification 2021-12-06
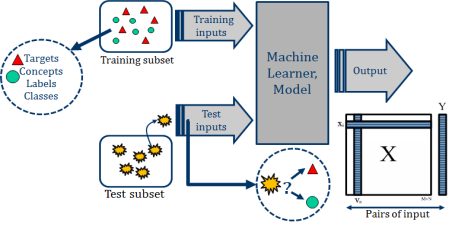
supervised learning practical diagram
K-means 对三螺线数据训练,分类结果不好,因为它是用于聚类的
Fuzzy C Means 是另一种改进的聚类算法,分类效果也不好
Decision Tree 分类器对三螺线的训练样本分类效果很好
K nearest neighbor 是非常强大的 lazy learner
Multilayer neural network 强大
Performance evaluation
- 分类器预测类别标签有多准确?选择哪个分类器(模型)更合适?
- Remember:
- The data have to be used both for training and testing.
- More training data → better generalization.
- More test data → better estimation for the classification error probability.
- Do not evaluate performance on training data → the conclusion would be optimistically biased. (否则会偏向训练集)
- Methods for estimating a classifier’s accuracy:
- Holdout method (reserve 2/3 for training and 1/3 for testing)
- random subsampling (iterative holdout)
- Cross-validation (partition the data into k folders
- Stratified oversampling and undersampling (保持类别比例)
- Bootstrap (sampling with replacement)
- Comparing classifiers:
- Confidence intervals
- Cost-benefit analysis and ROC Curves
- Once evaluation is finished, all the available data can be used to train the final classifier. (知道了最佳参数后,再用全部的数据训练最佳假设)
Hold out method
- Given data is randomly partitioned into two independent sets
- 比如:2/3 作为Training set 去构建模型,1/3作为Test set 去估计准确率
- Random sampling:
It is a variation of holdout method.
Repeat the method k times, accuracy is estimated as average of obtained accuracies.
Confusion matrix
-
Represents the number of correct and incorrect predictions made by the classification model in comparison with the real outcomes (actual class).
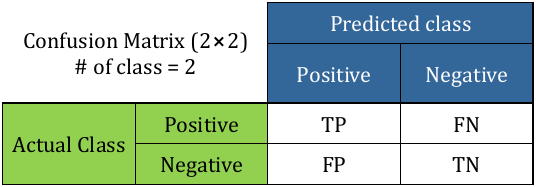
- TP or True positive:
# of tuples in class positive that were labeled by the classifier as class positive. - FN or False negative:
# of tuples in class positive that were labeled by the classifier as class negative - FP or False positive:
# of tuples in class negative that were labeled by the classifier as class positive. - TN or True negative
# of tuples in class negative that were labeled by the classifier as class negative.
- TP or True positive:
-
Evaluation measures
Measure Formula Accuracy, recognition rate (TP+TN)/all Error rate, misclassification rate (FP+FN)/all Sensitivity, true positive rate, recall TP/(TP+FN) Specificity, true negative rate TN/(TN+FP) Precision TP/(TP+FP) F, F1,F-score,
Harmonic mean of precision and recall$\frac{2 \times \rm Precision \times recall}{\rm Precision + recall}$ $F_\beta$ where $\beta$ is a none negative real number $\frac{(1+\beta)^2 \times \rm Precision \times recall}{\beta^2 \times \rm Precision +recall}$ - Accuracy/recognition rate: the proportion of the total number of predictions that were correct.
- Error rate: 1- accuracy
- Precision: what % of tuples that the classifier labeled as positive are actually positive (查准率)
- Recall: what % of positive tuples did the classifier label as positive? (查全率)
-
当数据几乎是均匀分布时:准确性可以成为一个很好的评估指标
比如100个人,99个没患癌,1个是癌症患者,但是模型结果是100个人都是健康,准确率99%,但它并不是可靠的模型。- Imbalanced data:
- There is an important class which is rare. e.g. cancerous patient
- Classifier may ignore the small class!
- Accuracy is not a good measurement as it does not consider FN rate that is so important in imbalanced data.
- In this case, classifier evaluation measures such sensitivity (or recall), specificity, precision, F-measure are better suited.
- Imbalanced data:
-
Evaluation 也可以关注其他的指标:
Speed, Robustness, Scalability, Interpretability
Receiving Operating Characteristic (ROC)
-
Represent a relation between sensitivity and specificity for a given classifier.
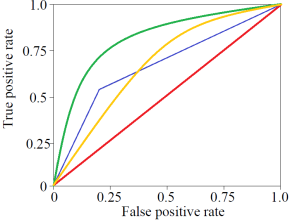
- The area under the curve is the measure of the accuracy of the classifier.
- The perfect accuracy is equal to one.
- The closer to red line, the less accurate model
如果模型的准确率显著低于红线,是不能接受的(有错)。ROC 曲线上升越快,越接近1,越好 (Learner 1最好)
-
It can be used for visual comparison of classification models.
-
ROC space:
Two dimensional:- FP rate on X axis → FPR=FP/(TN+FP)
- TP rate on Y axis → TPR=TP/(TP+FN) (灵敏度)
- FPR=1-SPC (= 1- 特异度)
Model Selection Criteria
Model selection criteria is always based on a compromise between the complexity of the model and its prediction accuracy on the training data
Given a dataset, basically we are looking for the simplest model that attains highest accuracy.
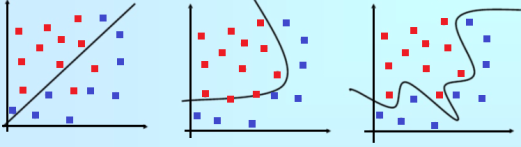
| Model 1 | Model 2 | Model 3 | |
|---|---|---|---|
| Complexity | ✓✓ | ✓ | x (overfit) |
| Training error | xx | ✓ | ✓✓ |
| Overall | - | ✓ | - |
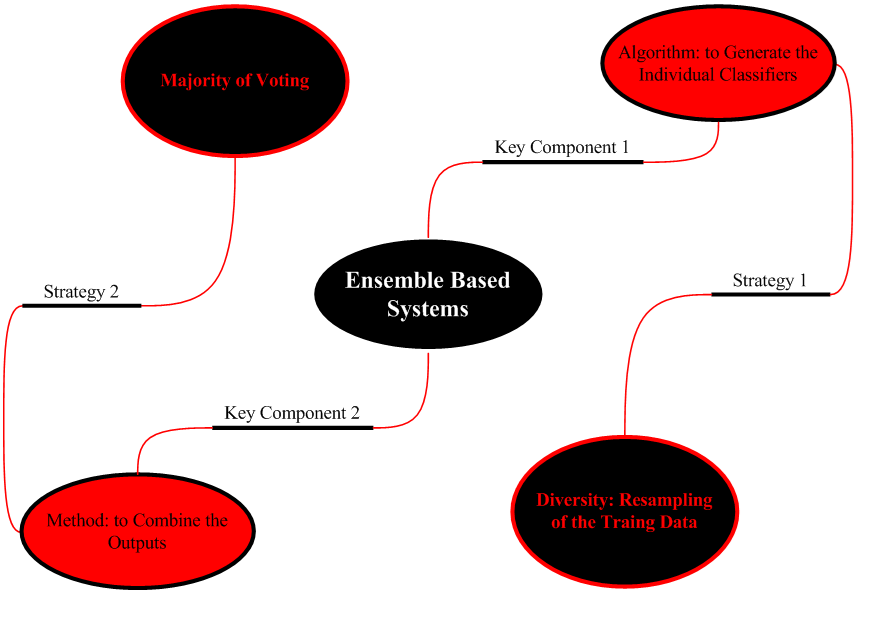
Ensemble system - Strategies & components
合奏系统
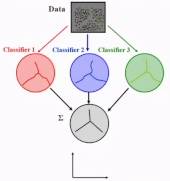
每次抽取不同的样本(子集),训练多个模型,然后聚合(aggregation)起来,误差可能更小
也可以训练不同种类的分类器:感知机,DT,kNN,SVM…
Ensemble 系统有两Key Component: 分类算法(注意训练集样本的多样性)和融合方法(简单:多数票)
Ensemble 适合用于很大容量数据,也可以用于很小容量数据。
-
Large volume data:
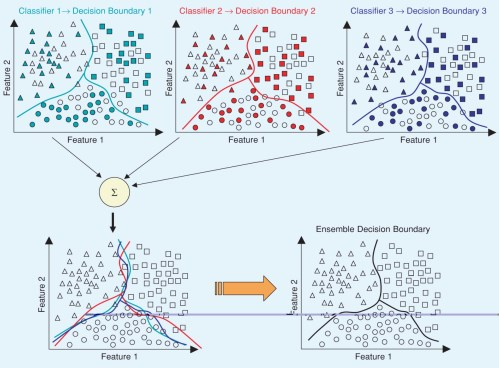
-
Small size data:
数据很少,用复杂的模型可能导致过拟合,所以第一次使用比较弱的感知机,有3个点分错了,增加它们的权重,使它们更可能被抽取到作为下一次的训练样本。第二次分类后,再强调分错的2个蓝点。第三次分类,就只有1个红点分错了。Ensemble 使得模型不复杂,更准确
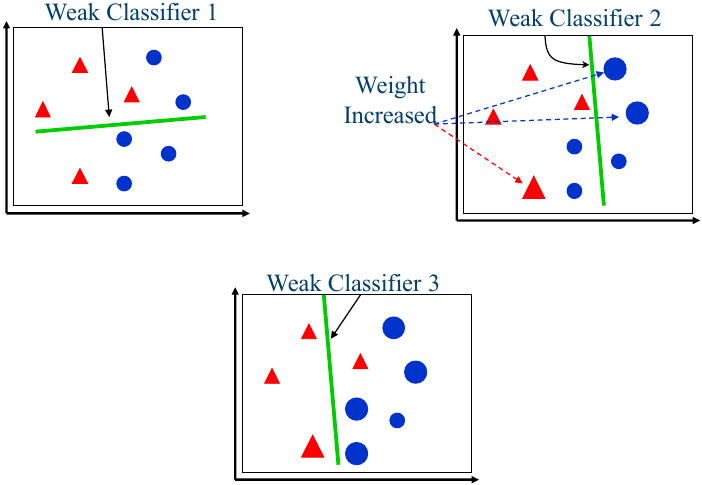
其他优势:处理复杂的决策边界,非线性情况,实时…