Table of contents
Debug Config
-
Open “launch.json” ➡ Clik blue button “Add Configuration…” at right-bottom corner ➡ Select “C/C++: (gdb) Launch”.
Then, a snippest of configuration with name
"(gdb) Launch"is inserted into the “configurations” field in the config file.1 2 3 4 5 6 7 8 9 10 11 12 13 14 15 16 17 18 19 20 21 22 23 24 25 26 27 28 29 30 31{ "version": "0.2.0", "configurations": [ { "name": "(gdb) Launch", "type": "cppdbg", "request": "launch", "program": "${workspaceFolder}/test", "args": [], "stopAtEntry": false, "cwd": "${fileDirname}", "environment": [], "externalConsole": false, "MIMode": "gdb", "setupCommands": [ { "description": "Enable pretty-printing for gdb", "text": "-enable-pretty-printing", "ignoreFailures": true }, { "description": "Set Disassembly Flavor to Intel", "text": "-gdb-set disassembly-flavor intel", "ignoreFailures": true } ], "preLaunchTask": "g++ compile" }, ] }This newly created configuration can be selected in the drop-down box beside the gear.
-
Add a task in tasks.json.
1 2 3 4 5 6 7 8 9 10 11 12 13 14 15 16 17 18 19 20 21 22{ "version": "2.0.0", "tasks": [ { "label": "g++ compile", "type": "shell", "command": "g++", "args": [ "${workspaceFolder}/test.cpp", "-g", "-o", "test" ], "options": { "cwd": "${workspaceFolder}" }, "group": { "kind": "build", "isDefault": true } }, ] }
The code “test.cpp” to be debugged is as follows:
|
|
View Memory
After debugging started,
-
Find the address of a variable
x:Add expression
&xinto “Watch” panel. SO -
Use VS Code’s generic memory view
- Install extention Hex Editor;
- Clik the binary data icon $[^{01}_{10}]$ following the address (not variables).
Another ways to view memory
-
Using extension Memmory View
-
Press F1,
MemoryView: Add new memory view (for debugger) -
Type the address of
x:0x7fffffffdbf0. Then, “MEMORY” section appers in the bottom panel.
-
-
Use GDB command
-exec x/64xb 0x7fffffffdc001 2 3-exec x/64xb 0x555558854e20 0x555558854e20: 0x03 0x00 0x00 0x00 0x00 0x00 0x00 0x00 0x555558854e28: 0x00 0x00 0x00 0x00 0x00 0x00 0x00 0x00- The byte at
0x555558854e20is 3.
- The byte at
Inspect array
-
Array on stack is the pointer to the array. The pointer is stored in:
&exampleArray=0x7fffffffdc00 -
After initializing, memory at
exampleArrayis 0,1,2,3,4:1 200007fffffffdc00 00 00 00 00 01 00 00 00 02 00 00 00 03 00 00 00 00007fffffffdc10 04 00 00 00 ff 7f 00 00 00 50 58 2b fa da fc 53- This array takes 16 bytes.
-
Array on heap is the address of pointer, which is stored in:
&exampleArray_heap=0x7fffffffdbf8100007fffffffdbf0 01 00 00 00 04 00 00 00 c0 b2 56 55 55 55 00 00 -
That’s an address: 00 00 55 55 55 56 b2 c0 (
0x000055555556b2c0), because the endianness of computer is in reverse order.After initializing by the for loop, heap memory of the array is:
1 2000055555556b2c0 00 00 00 00 01 00 00 00 02 00 00 00 03 00 00 00 000055555556b2d0 04 00 00 00
Read Address
Pointer’s value is an address.
-
Use
forloop to read 8 bytes one-by-one:1 2 3 4 5 6 7 8// Read the "address" (0x55555556b2c0) from memory (0x7fffffffdbf0) in bytes unsigned char* bytePointer = (unsigned char*)&exampleArray_heap; const int numBytesToRead = 8; unsigned char buffer[numBytesToRead]; for (int i=0; i<numBytesToRead; i++) buffer[i] = *(bytePointer + i); for (int i=0; i<numBytesToRead; i++) std::cout << std::hex << static_cast<int>(buffer[i]) << " ";Output:
1c0 b2 56 55 55 55 0 0 -
Another way is converting the type of pointer to
(long long*)1std::cout << std::hex << *(long long*)&exampleArray_heap << std::endl;And it will automatically reverse the number:
155555556b2c0
Python Calls Cpp
(2024-01-29)
Attach the GDB used for C++ application to the running Python debugger, following steps in Example debugging mixed Python C++ in VS Code - Nadiah Pardede Kristensen
-
Preparation: Compile the C++ code to a python package:
-
Make a folder for compiling the cpp package:
1 2 3 4 5 6 7 8 9 10 11(AIkui) yi@yi-Alien:~/Downloads/Cpp_Study$ tree . ├── cpp_ext_myadd | ├── debug_w_cpp.py │ ├── myAdd.cpp │ ├── setup.cfg │ └── setup.py └── .vscode ├── c_cpp_properties.json ├── launch.json └── settings.jsonwhere the myAdd.cpp file refers to code
The "setup.py" looks like:
1 2 3 4 5 6 7 8from distutils.core import setup, Extension def main(): setup(name="myadd", ext_modules=[Extension("myadd", ["myAdd.cpp"])], ) if __name__ == "__main__": main() -
Install package:
1(AIkui) yi@yi-Alie:~/Downloads/Cpp_Study$ pip install ./cpp_ext_myadd/The customize package
myaddwill be installed in the current environment. So, VS Code requires “Python:Select Interpreter” by pressing F1 to match the envrionment. -
Pyhon code:
1 2 3 4import myadd print("going to ADD SOME NUMBERS") x = myadd.myadd(5,6) print(x)Add a breakpoint at line 2 before getting into package functions. And add a breakpoint (at
z = x + y;) in the cpp file. Otherwise, the debugger won’t pause.
-
-
The method that needs to manually find the process ID:
-
Add 2 configurations for “Python” and “C/C++: gdb (Attach)” separately in the
launch.json.Default contents generated after clicking the blue button "Add Configuration..."
1 2 3 4 5 6 7 8 9 10 11 12 13 14 15 16 17 18 19 20 21 22 23 24 25 26 27 28 29 30 31 32{ "version": "0.2.0", "configurations": [ { "name": "(gdb) Attach", "type": "cppdbg", "request": "attach", "program": "/home/yi/anaconda3/envs/AIkui/bin/python3.10", "processId": "${command:pickProcess}", "MIMode": "gdb", "setupCommands": [ { "description": "Enable pretty-printing for gdb", "text": "-enable-pretty-printing", "ignoreFailures": true }, { "description": "Set Disassembly Flavor to Intel", "text": "-gdb-set disassembly-flavor intel", "ignoreFailures": true } ] }, { "name": "Python: Current File", "type": "python", "request": "launch", "program": "${file}", "console": "integratedTerminal", "justMyCode": true }, ] } -
With focusing on
debug_w_cpp.py, select the dubugger “Python: Current File”, and then click the green start button to kick off the debugging.When the debugger hits the breakpoint in
debug_w_cpp.py, find its process ID:1 2 3 4 5 6 7 8 9 10(base) yi@yi-Alien:~$ ps aux | grep python root 905 0.0 0.0 42744 1680 ? Ss 2023 0:00 /usr/bin/python3 /usr/bin/networkd-dispatcher --run-startup-triggers root 1278 0.0 0.0 121200 1436 ? Ssl 2023 0:00 /usr/bin/python3 /usr/share/unattended-upgrades/unattended-upgrade-shutdown --wait-for-signal yi 1605315 0.0 0.1 38840 26336 pts/5 S+ 16:17 0:04 /usr/bin/python3.8 -O /usr/bin/ranger yi 1698762 2.9 0.9 1179385796 150624 ? Sl 18:42 0:04 /usr/share/code/code --ms-enable-electron-run-as-node /home/yi/.vscode/extensions/ms-python.vscode-pylance-2023.12.1/dist/server.bundle.js --cancellationReceive=file:bad7d71dedf58b5bb22a36398d8eb2bcf4447338c7 --node-ipc --clientProcessId=1698586 yi 1700442 0.4 0.1 840012 18472 ? Sl 18:44 0:00 /home/yi/anaconda3/envs/AIkui/bin/python /home/yi/.vscode/extensions/ms-python.python-2023.22.1/pythonFiles/lib/python/debugpy/adapter yi 1700450 0.3 0.1 250260 18376 pts/6 Sl 18:44 0:00 /home/yi/anaconda3/envs/AIkui/bin/python /home/yi/.vscode/extensions/ms-python.python-2023.22.1/pythonFiles/lib/python/debugpy/adapter/../../debugpy/launcher 45763 -- /home/yi/Downloads/Cpp_Study/cross_lang_debug_host.py yi 1700456 3.1 0.1 414788 30468 pts/6 Sl+ 18:44 0:00 /home/yi/anaconda3/envs/AIkui/bin/python /home/yi/.vscode/extensions/ms-python.python-2023.22.1/pythonFiles/lib/python/debugpy/adapter/../../debugpy/launcher/../../debugpy --connect 127.0.0.1:55977 --configure-qt none --adapter-access-token 2bb19c19a6a1592229fd27c7c8e3e0a37c002b320568e3b3c8fe450a3d343404 /home/yi/Downloads/Cpp_Study/cross_lang_debug_host.py yi 1700778 0.0 0.0 12116 2776 pts/7 S+ 18:45 0:00 grep --color=auto pythonThe desired process is the one attached with a token: 1700456
-
Switch the debugger to “gdb (Attach)”, and then click the green start button again, it will ask the process ID just found.
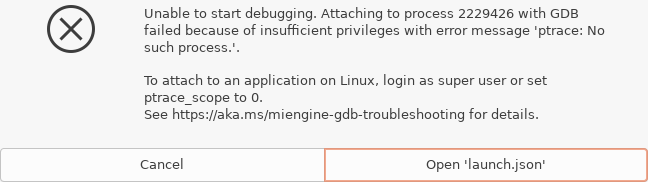
Then, a prompt pops:
1 2(base) yi@yi-Alienware:~/Downloads/Cpp_Study$ /usr/bin/env /bin/sh /tmp/Microsoft-MIEngine-Cmd-00cvveuw.5cg Superuser access is required to attach to a process. Attaching as superuser can potentially harm your computer. Do you want to continue? [y/N]However, after I input “y”, the terminal said executing GDB requires elevated permission, but it didn’t prompt me to enter password.
1 2 3 4 5==== AUTHENTICATING FOR org.freedesktop.policykit.exec === Authentication is needed to run `/usr/bin/gdb' as the super user Authenticating as: Yi Cao,,, (yi) Password: [1] + Stopped (tty output) /usr/bin/pkexec "/usr/bin/gdb" --interpreter=mi --tty=${DbgTerm} 0<"/tmp/Microsoft-MIEngine-In-tkwd0bog.wdj" 1>"/tmp/Microsoft-MIEngine-Out-n1p4gbjg.vvb" You have stopped jobs.
-
-
Extension: Python C++ Debugger eliminates the need of manually entering process ID.
Its default configuration in
launch.jsonis:1 2 3 4 5 6 7 8 9 10 11 12{ "version": "0.2.0", "configurations": [ { "name": "Python C++ Debug", "type": "pythoncpp", "request": "launch", "pythonConfig": "default", "cppConfig": "default (gdb) Attach", } ] }However, the authentication error persists.
-
Bypass the authentication:
1echo 0 | sudo tee /proc/sys/kernel/yama/ptrace_scopeRefer to: Debugging mixed Python C++ in VS Code. Can’t enter sudo password - SO
-
“This solution doesn’t require reboot, but it’s not permanent.” , as explained in Attaching gdb (C++ debugger) to remote python process in VSCode - SO (OP is Mark Harris) (Found by Perplexity)
Original answer
1 2 3 4 5 6 7$ gdb --pid=30428 ... Attaching to process 30428 Could not attach to process. If your uid matches the uid of the target process, check the setting of /proc/sys/kernel/yama/ptrace_scope, or try again as the root user. For more details, see /etc/sysctl.d/10-ptrace.conf ptrace: Operation not permitted.
-
In this example, I found that the debugger cannot step downward after entering the cpp file, instead, it gets stuck at the line following the breakpoint.
However, the method works in the project of AIkui’s CUDA extension tutorial,
where the debugger moves line-by-line after jumping into “interpolation_kernel.cu” files (function: trilinear_fw_cu()),
whereas it can’t step into kernel functions, which may require CUDA-GDB,
rather than GDB.
- It seems that after GDB concludes the execution of C++ programm, it will stay at the last line, and won’t automatically return to the Python debugger. So, I have to click the “disconnect” button on the control bar to free the GDB.
Other problems:
-
If the file currently open in the editor is not the Python file “debug_w_cpp.py”, but rather “myAdd.cpp”, an error pops upon clicking the start button:
-
The following command for installing cpp packege, referring How to pass –debug to build_ext when invoking setup.py install?, requires the path to source file relative path to workspaceFolder in the “setup.py”:
ext_modules=[Extension("myadd", ["./cpp_ext_myadd/myAdd.cpp"])]1(AIkui) yi@yi-Alienware:~/Downloads/Cpp_Study$ python3.10 ./cpp_ext_myadd/setup.py build_ext --debug install
(2024-04-18)
-
Will’s practice: 使用PythonCppDebugger联合调试Python与Cpp,以及应用到3DGS的若干尝试 - will的文章 - 知乎
利用vscode的插件PythonCppDebugger,gdb选用cuda拓展的cuda-gdb; 相比于:“利用vscode的插件PythonCppDebugger,gdb选用cpp拓展的cppdbg”, 程序会突然崩溃,(chatGPT)怀疑是gs本身显存管理过于复杂,长时间的debug容易崩溃所致。 最终由于实在不稳定,笔者放弃使用该方法,选用笨办法: 把python端数据存成txt,然后另起一个c++项目调试cuda代码。 另可见笔者的issue: Question aboud cuda-gdb extension in attach process · Issue #32 · benibenj/vscode-pythonCpp
Illustrate A C Project
Call Graph
References:
-
Call Graph - Visual Studio Marketplace - LuoZhihao
- Asked ChatGPT: What’s the best illustration for an embedded project written in C-lang? I want to show the calling relationship of functions and show which functions are defined in which files.
-
GitHub - chaudron/cally
- The term “Call Graph” can be surfaced by keywords:
How to illustrate calling relationship in a C projectin DDG
- The term “Call Graph” can be surfaced by keywords:
-
请问支持c/c++吗 - issue #11 - beicause/call-graph
- Drived by the error when trying to run its command.
-
Crabviz - Visual Studio Marketplace - Chan HoCheung
- Searched by
call graphin VSCode Extensions
- Searched by
Notes:
(2024-12-17)
-
Call Graph is for Java r1-Mrktp.
-
I can’t used it for a C project, although it’s based on VSCode call hierarchy language feature. r3-Issue
Run command:
CallGraph.showOutgoingCallGraphwill prompt an error: This command is not found.
-
-
Many tools are there:
- Cally r2-GitHub, a C project call graph generator using GCC’s generated Register Transfer Language (RTL) files
-
Crabvizr4-Mrktp, interative call graph generator
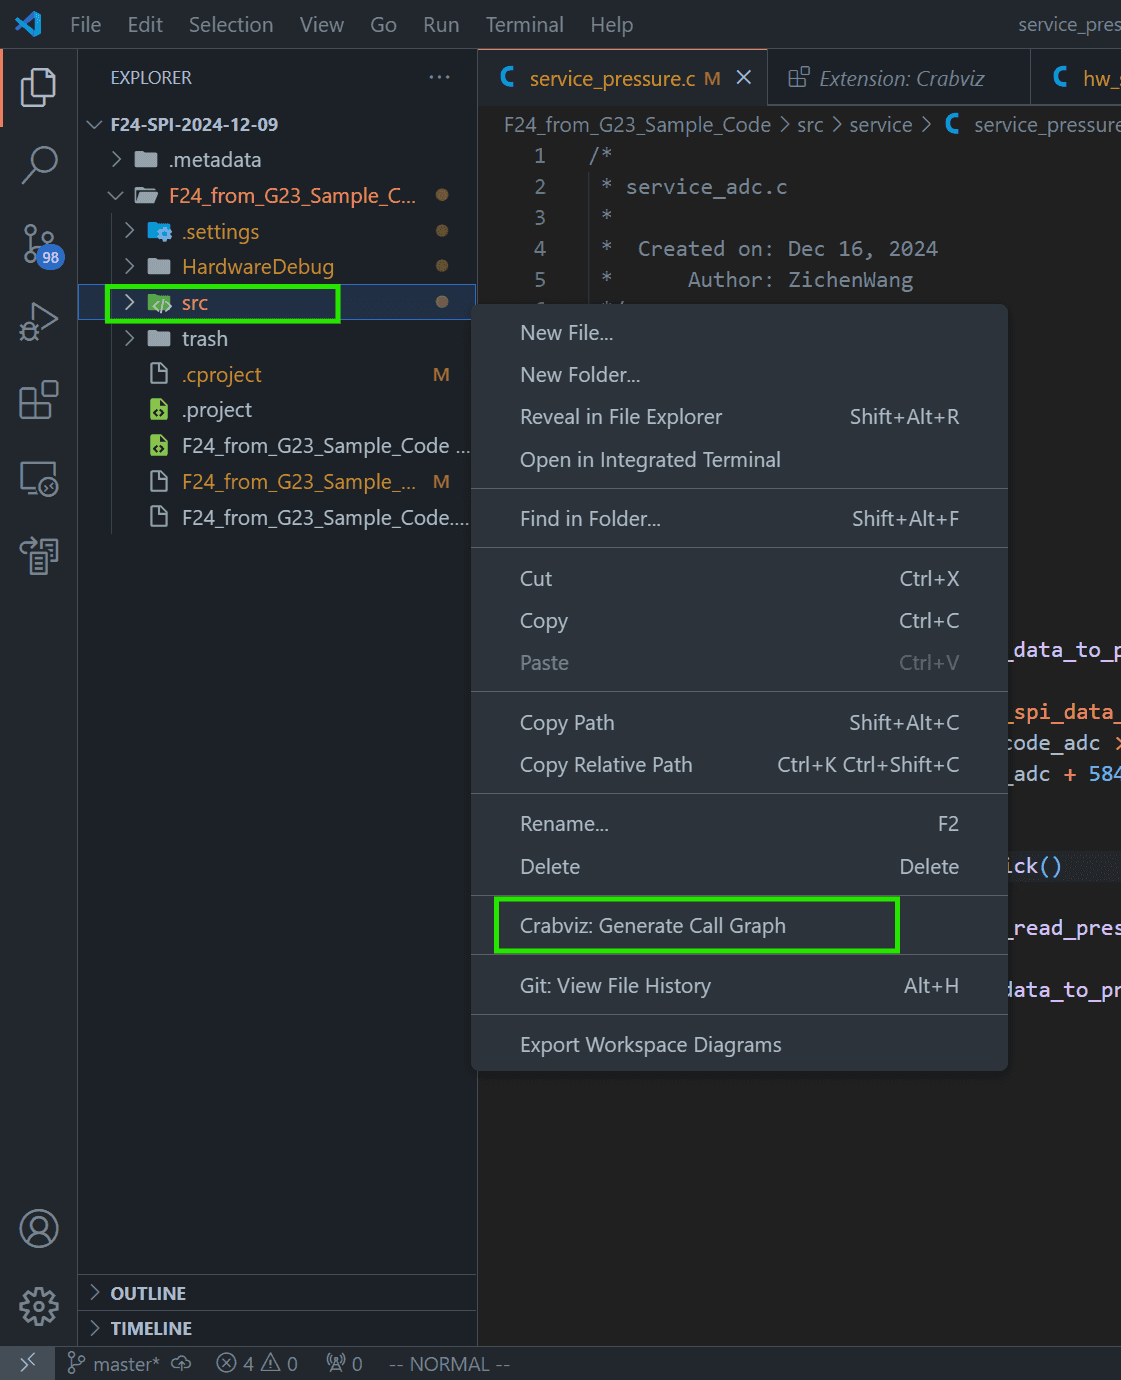
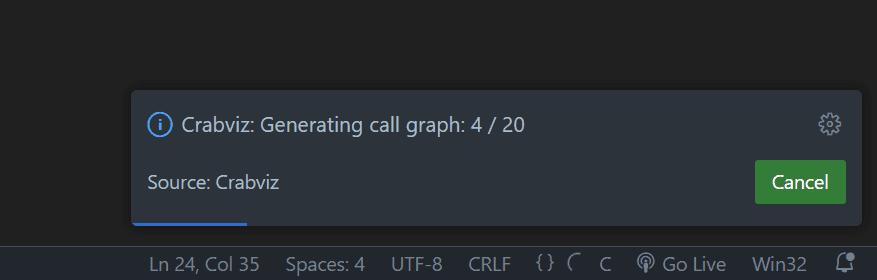
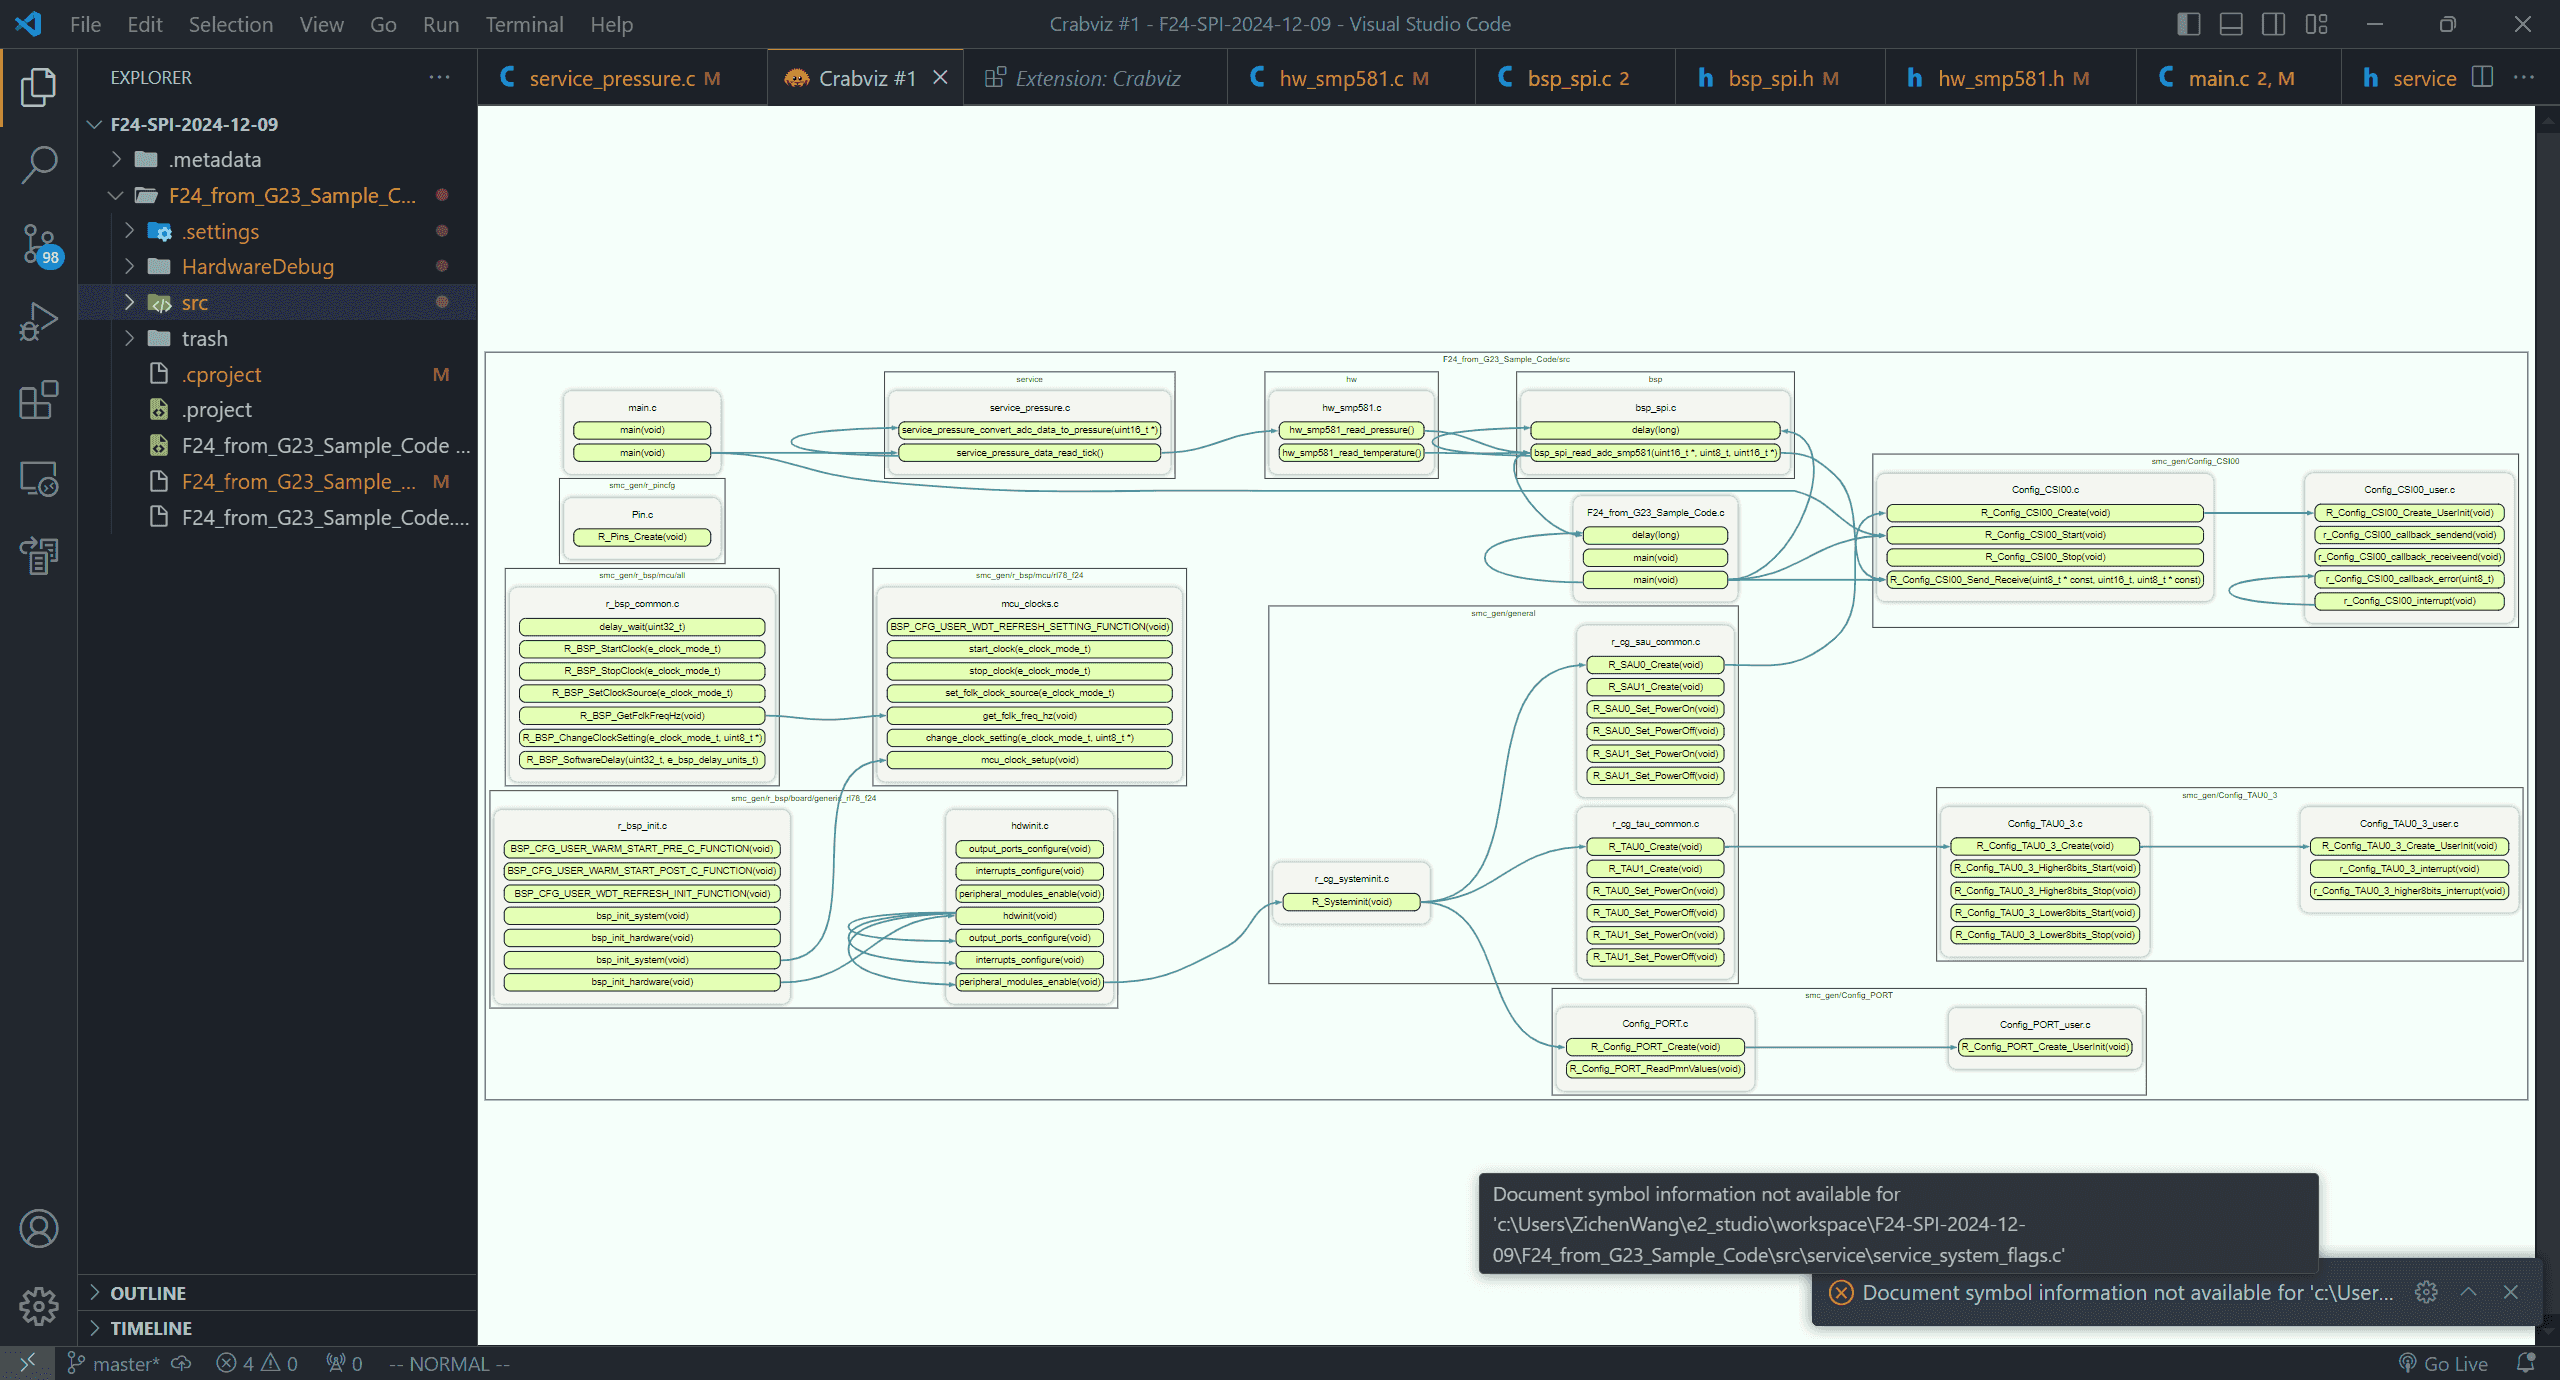
-
Call Graph of Embedded Software
-
References:
-
Supports
(2025-07-08T09:46)
- Renesas CS+ has call graph panel
-
Code Understand
AI Chat
-
DeepWiki
-
References:
-
DeepWiki | AI documentation you can talk to, for every repo
- Mentioned in discord: TheCW’s Server
-
DeepWiki | AI documentation you can talk to, for every repo
-
Supports:
(2025-08-20T08:26)
- DeepWiki was developed by TheCW. It has contained some popular repos r1-DeepWiki